Agent Executions
Learn about agent executions and how to implement it effectively.
3 min read
🆕Recently updated
Last updated: 12/9/2025
Agent Executions & Monitoring
Understanding agent execution and real-time monitoring is essential for debugging, auditing, and optimizing your intelligent workflows. InnoSynth-Forjinn provides a robust interface and API for examining how agents make decisions, what data they access, and how their actions influence results.
What is an Agent Execution?
An Agent Execution refers to one complete run or transaction through an agent-powered workflow. This may span:
- A single prompt/response cycle,
- Multi-step problem-solving with tool/chain calls,
- Multi-agent communication and orchestration (for Supervisor/Worker patterns).
Execution Monitoring Features
1. Execution Logs
- Access execution history for any agent in the "Agent Executions" section of the platform.
- Each run includes: start/end time, input parameters, decision path, tool calls, outputs, and all intermediate data ("trace").
2. Real-time Monitoring
- During live execution, use the UI to view "steps" as the agent makes tool calls, waits for user input, or branches based on conditions.
- Streaming Output: If chat output is configured for streaming (via SSE), you see responses and reasoning unfold in real time.
3. Metrics & Usage Stats
- Track:
- Number of invocations (per agent, user, or workspace)
- Duration/timing per execution
- Token counts and model usage
- Rate limits, failures, retries
- Visual charts are available in the Monitoring and Analytics sections.
4. Tool Call & Reasoning Trace
- For each execution, view a tree/log of:
- User input
- Agent internal "thoughts" (reasoning text, if available)
- Tool call names, parameters, outputs, response times
- Branches taken on conditions and returned results
- Useful for understanding complex ReAct or tool-using agents.
5. Error & Exception Handling
- If an execution fails, details are captured:
- Error type/message
- Failing node/tool name
- Stacktrace if available (for custom node failures)
- Failed runs are flagged, and can trigger notifications via webhooks or integrations.
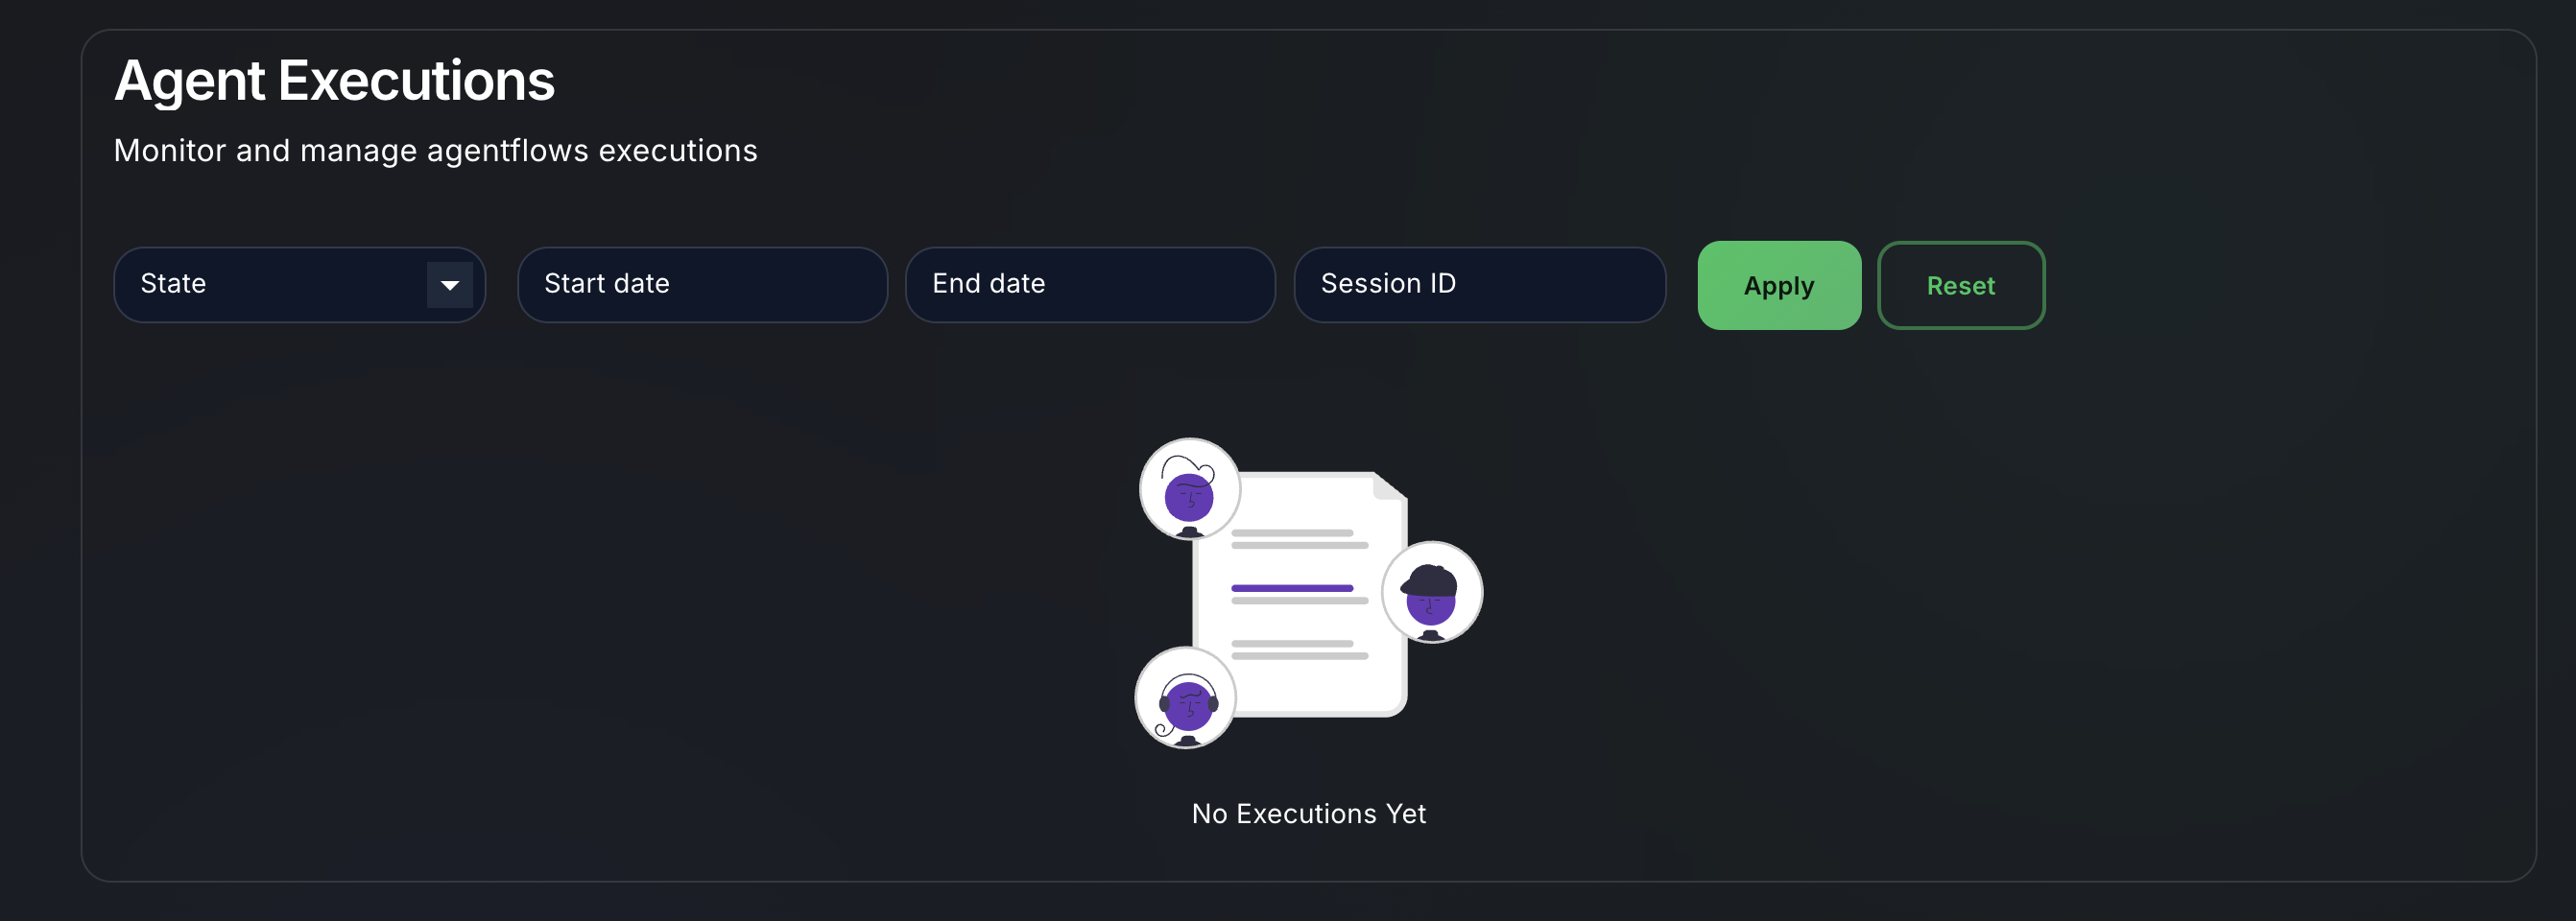
Using the UI
- Navigate to Agents > Executions in the main sidebar.
- Filter executions by agent, date, user, status (success, failed, in progress).
- Click any row to expand full step-by-step logs and preview all inputs/outputs.
- Use download/export for logs (JSON/CSV) for external analysis or reporting.
Monitoring with the API
- Use REST endpoints to fetch execution logs and statuses.
GET /api/v1/agent-executions?agentId=<id>&status=failed GET /api/v1/agent-executions/<executionId> - Integrate with external analytics (e.g., LangFuse, Arize, LangSmith) via platform hooks.
Advanced: Tracing Inter-Agent Communication
For multi-agent/supervisor patterns:
- Each message, request, or tool call between agents is logged with correlation IDs.
- Step/chain calls are linked so you can reconstruct the sequence across agents and tools.
Best Practices
- Use descriptive labels for agents and tools, so logs are readable.
- Regularly review error logs to catch model/credential misconfigurations.
- Instrument long-running or complex agent chains with additional Trace nodes or State updates to aid debugging.
For more, see Analytics Integration for connecting external monitoring and tracing platforms.